
When you have your hearing checked by an audiologist, the audiologist may give you an audiogram like the one shown below after the test is done. You may be confused.
Today, we will briefly show you how to read and interpret your audiogram so you could better understand your hearing loss. Let’s get it started.
How are the curves generated?
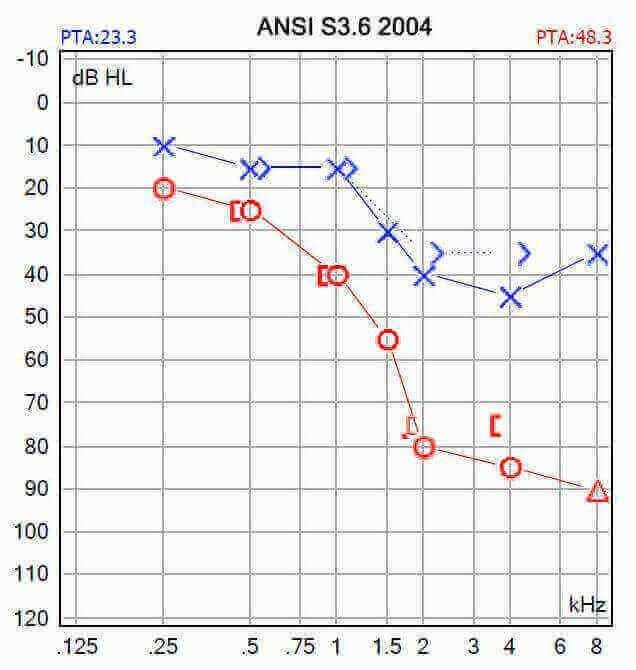
Each symbol on the chart represents your threshold for a given frequency.
During your hearing test, the audiologist will set the audiometer to emit sounds at a certain frequency but with different decibels, and the lowest sound volume you could hear is your threshold at that frequency. In the example below, the individual’s threshold for 2000 Hz was 80 dB for right ear-see the red curve.
Once all of the thresholds are measured and plotted on the graph, they are connected to curves.
What do the horizontal and vertical coordinates mean?
We see that there are two coordinates.
These vertical numbers represent the intensity of sound, that is, the vibration amplitude of sound waves transmitted to your position, which is usually expressed in decibels (dB).
The horizontal coordinates represent the frequency of the sound, which is the number of times a sound wave vibrates every second. The lowest frequency tested is usually 250 hertz (Hz) and the highest frequency tested is usually 8000 Hz.
What do the symbols stand for?
A general audiogram uses blue and red to distinguish between the left and right ears, with blue symbols representing left-side hearing and red symbols representing right-side hearing.
There are 2 different headsets you are wearing during your hearing test. Testing with headphones is called air conduction testing because the sound must travel through the air of the ear canal to reach the inner ear. Usually “X” is used for air conduction for the left ear and “O” for air conduction for the right ear.
Bone conduction testing, in which a device is placed behind the ear in order to transmit sound through the vibration of the mastoid bone. Usually “>” is used for the left ear bone conduction and “<” or “[” for the right ear bone conduction.
So how much hearing loss do you have?
For example, if we look at the right ear, represented in red in the diagram above, the 8k frequency corresponds to 90dB, which means that at this frequency, no sound below 90dB can be heard by the patient.
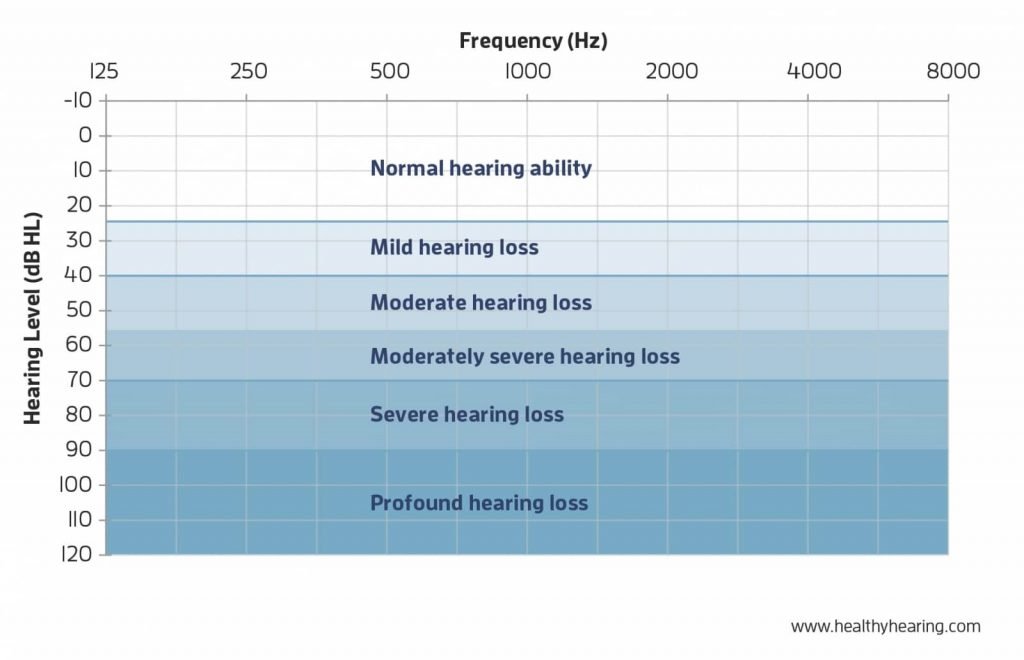
You may also want to get an idea of the degree of hearing loss. A normal person can hear most sounds only with 25dB, if the patient needs more than 90dB so he can hear, it means that the hearing loss is severe or profound even.
Well, here we briefly explain how the audiogram is generated, what the hearing threshold means, what the horizontal and vertical coordinates represent, etc. You already have a basic understanding of the audiogram now. Next time, we will further explain conductive hearing loss and sensorineural hearing loss and the different types of conductive hearing loss.
Reference: https://www.healthyhearing.com/report/52516-The-abc-s-of-audiograms
I have got my test result but carnt understand it
Hello, you could ask your doctor for help, they are more professional.